Why Rare Disease Research Matters
Rare diseases affect over 300 million people worldwide, yet only 5% of these conditions have an approved treatment (Global Genes, 2023). The challenges in researching and developing therapies for these diseases include small patient populations, limited funding, and complex trial designs. Clinical trials play a critical role in advancing treatments, but their progress is often hindered by recruitment difficulties, regulatory hurdles, and high costs.
To accelerate breakthroughs, data visualization has emerged as a powerful tool—transforming raw clinical trial data into actionable insights that drive better decision-making for researchers, regulators, and biotech investors.
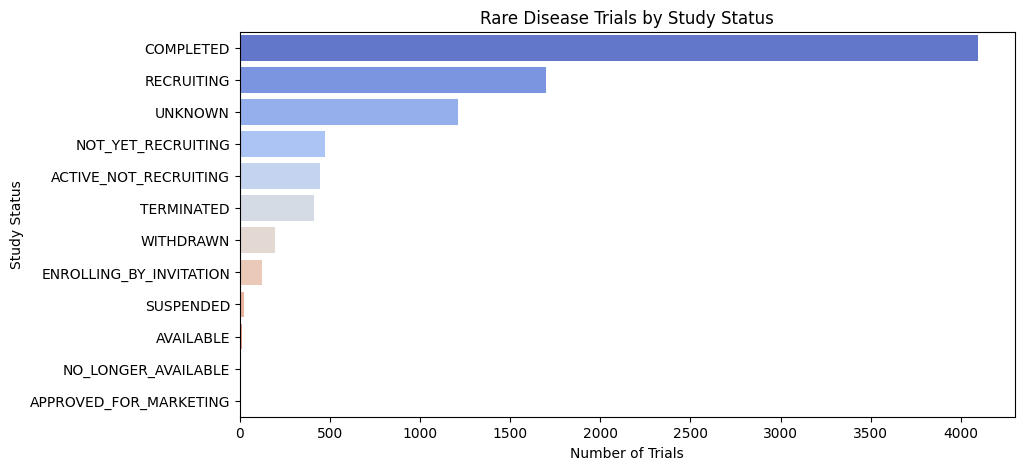
Rare Disease Trials: Key Insights from Study Status Data
Analyzing the distribution of rare disease clinical trials by study status reveals critical trends and challenges:
- High Completion Rate: The majority of trials are completed, indicating active research, but their clinical impact needs evaluation.
- Strong Recruitment Activity: Many trials are actively recruiting, yet challenges in patient enrollment persist due to small sample sizes.
- Unclear Trial Status: A significant number of trials have an “Unknown” status, suggesting potential reporting gaps or stalled studies.
- Recruitment Bottlenecks: Several trials remain in “Not Yet Recruiting” or “Active, Not Recruiting” phases, highlighting delays in enrollment or regulatory approvals.
- Trial Failures: Terminated and withdrawn trials point to funding issues, safety concerns, or feasibility challenges.
These insights emphasize the need for better recruitment strategies, transparent trial reporting, and streamlined regulatory pathways to accelerate rare disease drug development.
Clinical Trial Enrollment Distribution Plot
Clinical trials are a cornerstone of medical advancement, rigorously evaluating the safety and efficacy of new treatments. A critical aspect of trial design is determining the appropriate number of participants for each phase. This post delves into the distribution of participant enrollment across different trial phases using a box plot visualization, revealing key trends and offering valuable insights.
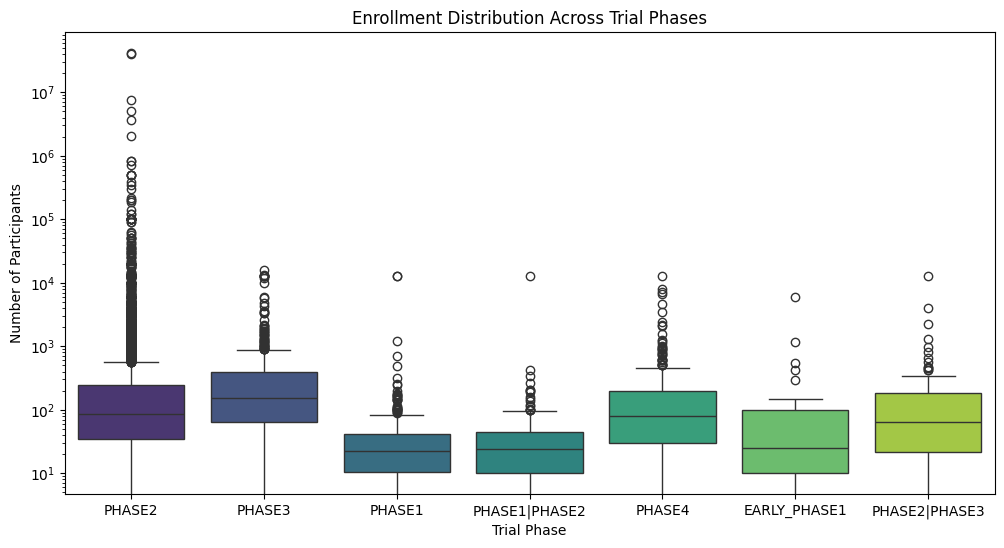
Key Insights from the Enrollment Distribution Plot:
- Phase 2 and Phase 3 Trials Drive Enrollment: The visualization clearly demonstrates that Phase 2 and Phase 3 trials typically require significantly larger participant cohorts compared to other phases. This aligns with their primary objectives: evaluating therapeutic efficacy and establishing optimal dosage regimens. Larger sample sizes are essential for achieving statistical significance and robust results.
- Early-Phase Trials (Phase 1, Phase 1/2, Early Phase 1) Feature Lower Enrollment: Early-phase trials, primarily focused on assessing safety and pharmacokinetics/pharmacodynamics (PK/PD), understandably involve smaller participant groups. This allows researchers to meticulously monitor for adverse events and determine a safe and tolerable dose range before progressing to larger studies.
- Significant Enrollment Variability Across Phases: The wide boxes and numerous outliers, particularly observed in Phase 2 and Phase 3, highlight the substantial variability in enrollment numbers. This underscores the fact that each trial is unique, with specific requirements dictated by factors such as the therapeutic area, study design, disease prevalence, and research objectives.
- Analyzing Enrollment Outliers: The presence of outliers warrants further investigation. Are these exceptionally large trials for blockbuster drugs targeting prevalent conditions? Or perhaps trials for rare diseases necessitating global collaboration for adequate recruitment? Investigating these outliers can yield valuable insights into the complexities of clinical trial enrollment.
Implications for Stakeholders:
- Researchers: Understanding enrollment trends facilitates effective planning and budgeting for future trials, including resource allocation for patient recruitment and retention.
- Sponsors: Data-driven decisions regarding resource allocation, recruitment strategies, and timeline projections.
- Patients: Increased awareness of the different trial phases and the critical role of patient participation in advancing medical research.
Gender Distribution in rare disease trials
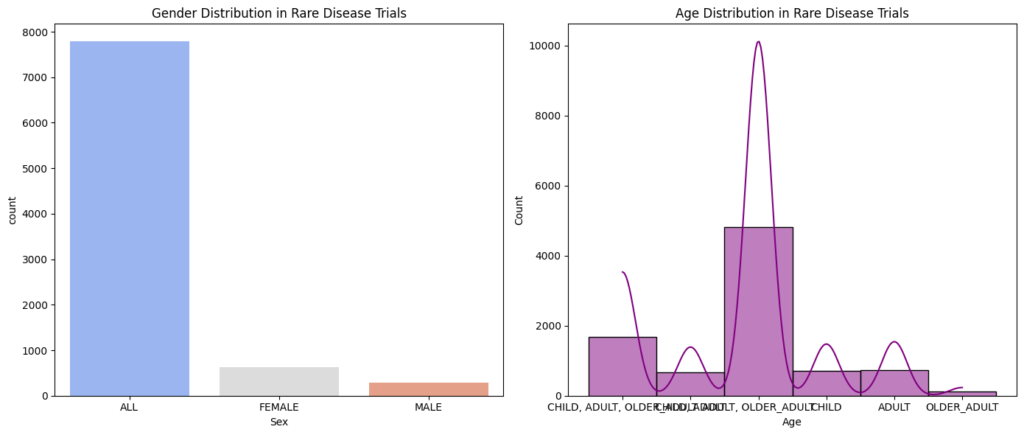
Insight on Gender Distribution:
- Overall Imbalance with “ALL” Dominance: The data reveals a significant disparity in gender representation, with a considerably higher proportion of “ALL” participants compared to both female and male participants. This still highlights a potential gap in gender-specific reporting or a true underrepresentation of certain genders in rare disease trials. However, it’s important to acknowledge that the “ALL” category likely includes individuals of both sexes where gender was not specified, making direct comparisons complex.
- Female Representation Higher Than Male: The number of female participants is higher than the number of male participants, suggesting that, among those specifically identified, females are more represented in these rare disease trials.
- Male Representation: While male participation is lower than female, it is still a significant portion of the explicitly identified participants. Further investigation is needed to understand the composition of the “ALL” group and to ensure that male patients are adequately represented within the context of the available gender-specific data.
Insights on Age Distribution:
- Older Adult Dominance (Among Specified Groups): The “OLDER ADULT” category has the highest number of participants among the age groups specifically listed. This is a significant finding and suggests that older adults are a substantial portion of participants in rare disease trials.
- Adult Representation: While the “ADULT” category has a considerable number of participants, it is less than the “OLDER ADULT” category.
- Combined Age Categories: The presence of combined categories like “CHILD, ADULT, OLDER ADULT” still makes it difficult to understand the true distribution across all age groups. More granular data is needed.
- Limited Child Participation: The relatively low number of participants in the “CHILD” category alone still suggests potential challenges in recruiting children with rare diseases.
Implications and Recommendations:
- Improved Gender Reporting: Standardized and detailed reporting of gender data is crucial to accurately assess representation and address any disparities.
- Targeted Recruitment Strategies: Developing targeted recruitment strategies to address the underrepresentation of specific genders and age groups.
- Age-Appropriate Trial Design: Ensuring that trial designs and protocols are appropriate for the specific age groups being studied, including pediatric and geriatric populations.
- Further Research: Conducting further research to explore the factors contributing to observed gender and age distributions in rare disease trials.
- Patient Advocacy: Empowering patient advocacy groups to raise awareness about the importance of diverse participation in research.
Insights from Geographic Distribution of Rare Disease Trials.

1. The United States has the most trials conducted, followed by Europe and Asia.
2. Africa has the fewest trials conducted.
3. There is a wide variation in the number of trials conducted across regions.
4. Some regions, such as South America and Oceania, have very few trials conducted.
Top 10 study design

- Dominance of Observational Studies:
- These studies help us understand the natural course of rare diseases, identify risk factors, and explore potential biomarkers – all of which are essential for developing effective treatments and improving patient care.”
- “For instance, observational studies might track the progression of a rare disease over time, examine genetic and environmental factors, or investigate the impact of the disease on patients’ quality of life.”
- Importance of Interventional Studies:
- “While less numerous than observational studies, ” interventional studies play a vital role- clinical trials testing new treatments and therapies. This is encouraging news, as it demonstrates a commitment to finding solutions for rare diseases.”
- “However, it’s important to consider why intervention studies are so prevalent. Are funding priorities skewed towards treatment development? Do regulatory pathways favor interventional trials?”
- Diverse Research Approaches:
- “The chart also showcases a range of other study types, including ‘Diagnostic,’ ‘Prevention,’ ‘Health Services Research,’ and more. This diversity reflects a broader effort to address rare diseases from multiple angles.”
- (Example) “For example, ‘Screening’ studies aim to identify individuals at risk for a particular rare disease, allowing for early intervention and potentially better outcomes.”
- The “Other” Category and Data Bias:
- “The sizable ‘Other’ category raises questions about how we classify rare disease research. It’s crucial to understand what types of studies fall into this category and whether our current classifications are adequately capturing the full spectrum of research activities.”
- “This highlights the need for ongoing evaluation and refinement of research categorization to ensure accurate representation and analysis.”
Top 10 sponsors in rare disease trials

- Dominance of Academic Medical Centers: The list is heavily populated by universities and university-affiliated hospitals (e.g., University Hospital, Strasbourg; Assistance Publique – Hôpitaux de Paris). This suggests that a significant portion of rare disease trial sponsorship comes from academic institutions, highlighting their crucial role in this research space.
- National Institutes of Health (NIH) Influence: The presence of NIAID (National Institute of Allergy and Infectious Diseases) and NCI (National Cancer Institute), both part of the NIH, underscores the substantial role of government funding in rare disease research, particularly in areas related to immune and cancer-related rare diseases.
- International Collaboration: The list spans institutions across different countries (France, Italy, Taiwan), indicating a global effort in rare disease research. This suggests collaborative networks and knowledge sharing across borders.
- Varied Therapeutic Focus: While not explicitly stated, the diverse range of institutions hints at a broad spectrum of rare diseases being studied. For example, NIAID’s presence suggests a focus on infectious and immune-related rare conditions, while NCI’s involvement points towards rare cancers.
- Potential for Patient Advocacy Groups: While not directly shown, the involvement of academic centers often implies collaboration with patient advocacy groups. These groups play a vital role in raising awareness, funding research, and supporting patients with rare diseases.
Distribution of enrollment in different trial phases.

- Phase 3 Trials Show Highest Variability and Potential for Large Enrollment:
- The Phase 3 box is the tallest, indicating the highest variability in enrollment numbers. This is expected as Phase 3 trials are typically larger and more comprehensive, involving a wider range of participants to confirm efficacy and monitor side effects.
- The upper whisker of the Phase 3 box extends the furthest, suggesting the possibility of some exceptionally large trials in this phase.
- Phase 2 Trials Also Show Significant Variability:
- The Phase 2 box is also relatively tall, indicating substantial variability in enrollment, though less than Phase 3. This suggests that Phase 2 trials, which explore dosage and efficacy, can also vary considerably in size depending on the specific research question and condition.
- Phase 1 Trials Have Lower Enrollment and Less Variability:
- The Phase 1 box is shorter and lower on the chart, indicating both lower median enrollment and less variability. This is consistent with Phase 1 trials primarily focusing on safety and pharmacokinetics in a small group of healthy volunteers or patients.
- Phase 4 Trials Show Moderate Variability and Enrollment:
- Phase 4 trials, which occur post-marketing to monitor long-term effects, show moderate variability and enrollment numbers. This suggests that while these trials are important for gathering real-world data, they may not always require the large-scale enrollment seen in earlier phases.
- Early Phase 1 and Combined Phase Trials Have Limited Enrollment:
- The boxes for Early Phase 1 and combined phases (Phase 1/Phase 2, Phase 2/Phase 3) are generally smaller and lower, indicating limited enrollment and less variability. This could be due to the specific nature of these trials, often involving specialized designs or focusing on specific subpopulations.
- Potential Outliers in Several Phases:
- Several phases exhibit potential outliers (points outside the whiskers), indicating trials with exceptionally high or low enrollment compared to the majority. These outliers could represent unique study designs, rare disease trials, or other factors that warrant further investigation.
Distribution of rare disease clinical trial durations
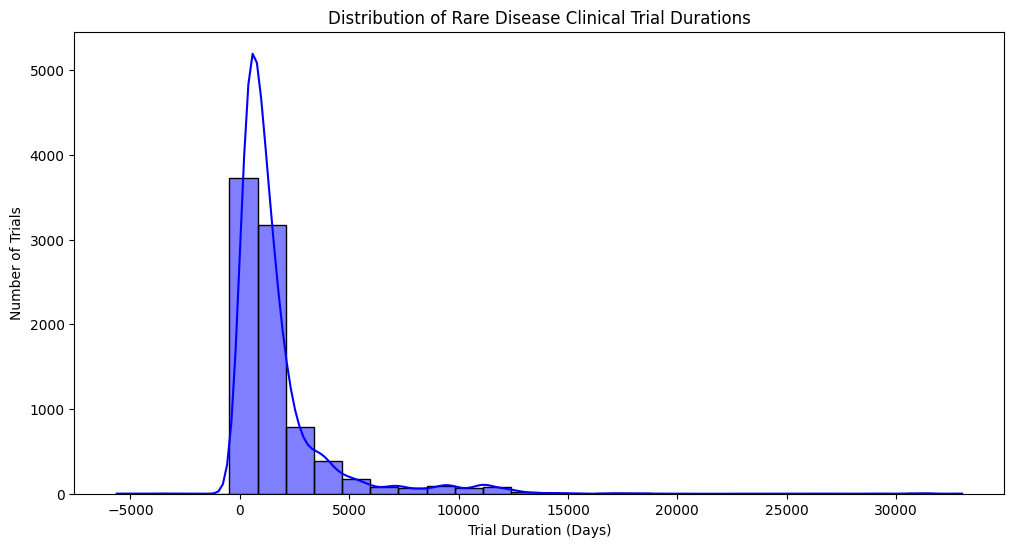
- Highly Skewed Distribution: The distribution is strongly skewed to the right (positively skewed). This indicates that the majority of rare disease clinical trials have relatively short durations, while a small number of trials can last for a very long time.
- Peak Around 0-2500 Days: There’s a prominent peak in the histogram and KDE around 0-2500 days, suggesting that most trials conclude within this timeframe (approximately 7 years).
- Long Tail Extending to the Right: The long tail extending to the right indicates that some trials can last for many years, even decades. These long-duration trials could be studying chronic conditions, long-term effects of treatments, or requiring extended follow-up periods.
- Negative Values on the X-Axis? The presence of negative values on the x-axis is unusual and requires explanation. It could indicate:
- Data Entry Errors: Potentially, some durations were entered incorrectly as negative values.
- Study Design Nuances: In some cases, negative values might represent specific time points or offsets within the trial design. For example, a baseline measurement taken before the actual start of the trial intervention could be recorded as a negative duration.
- Data Transformation or Adjustment: The data might have undergone some transformation or adjustment that resulted in negative values.
- Possible Bimodal or Multimodal Behavior? While less pronounced, there might be a hint of bimodality or multimodality in the distribution, with a smaller bump or shoulder visible around 5000-7500 days. This could suggest that there are distinct subgroups of trials with different typical durations.
Clinical Trial Success Rate by Study Status

- Dominance of “Completed” Trials: The largest segment (47.1%) represents “Completed” trials. This is expected, as clinical trials are designed to have a defined endpoint. It also serves as a good reminder that a substantial portion of trials do reach completion.
- Low Success Rate for Completed Trials: Despite the large number of completed trials, the success rate is only 19.5%. This highlights the challenges and inherent risks in clinical research, particularly in the development of new treatments.
- Significant Number of Recruiting Trials: The second largest category is “Recruiting” (14%). This indicates ongoing research efforts and a continued pursuit of new treatments and therapies.
- Low Success Rate for Recruiting Trials: The success rate for recruiting trials is remarkably low, at just 5.41%. This could be due to several factors, including:
- Early Stage of Development: Recruiting trials are often in earlier phases (Phase 1 or 2), where the likelihood of success is generally lower.
- Stringent Success Criteria: Success in clinical trials is rigorously defined and can be difficult to achieve.
- High Attrition Rate: Many potential drugs or interventions fail to demonstrate safety or efficacy during the trial process.
- “Unknown” Status Trials: A notable portion of trials (5.12%) have an “Unknown” status. This lack of clarity makes it difficult to assess the overall success rate and highlights the need for better transparency in reporting trial outcomes.
- Low Success Rates Across Most Categories: Most other categories, including “Active, Not Recruiting,” “Enrolling by Invitation,” etc., have very low success rates. This underscores the challenges in translating research findings into successful clinical interventions.
- Potentially Misleading “Success” Metric: The chart defines success as “the proportion of trials that have a ‘success’ status in each category.” This definition may not reflect true clinical success (i.e., leading to an approved treatment). It’s essential to understand how “success” is defined within the context of this data.
- Need for Further Investigation: The chart raises several questions that warrant further investigation. What are the specific reasons for the low success rates? Are there particular therapeutic areas or trial designs that are more successful than others? What can be done to improve the efficiency and success of clinical trials?
Distribution of Rare Disease Clinical Trial Phases

- Phase 2 Dominance: The most striking observation is the overwhelming proportion (81.6%) of trials categorized as “PHASE2.” This suggests a strong concentration of research efforts in this phase for rare diseases.
- Relatively Small Proportions in Other Phases: Compared to Phase 2, the other phases (Phase 3, Phase 4, Phase 1, combined phases, and Early Phase 1) represent significantly smaller proportions of total trials.
- Phase 3 as Second Largest: Phase 3 trials make up the second largest category at 6.97%. This is expected as Phase 3 trials are generally larger and designed to confirm efficacy and safety before regulatory approval.
- Low Representation of Phase 1: Phase 1 trials, which primarily focus on safety and dosage in small groups, constitute only 2.55% of the total. This could suggest challenges in transitioning from preclinical research to early-stage human trials for rare diseases.
- Small Percentages in Phase 4 and Combined Phases: Phase 4 trials (post-marketing surveillance) and combined phases (e.g., Phase 1/2, Phase 2/3) make up very small percentages (4.16%, 1.2%, 0.598%, and 2.93% respectively). This could be due to several factors, such as the rarity of diseases making recruitment difficult or the focus being primarily on getting treatments approved through Phase 2 and 3.
- Early Phase 1 Trials are Minimal: Early Phase 1 trials have the lowest representation at just 0.598%. This could be due to the highly specialized nature of these trials or challenges in developing appropriate methodologies for ultra-rare conditions.
Top 15 Rare Diseases with Most Clinical Trials

- ADHD as a Leading Focus: The high number of trials for Attention Deficit Hyperactivity Disorder is notable. You might want to explore the reasons behind this, such as prevalence, increasing awareness, or funding availability. Important Note: While ADHD is often diagnosed in childhood, it can persist into adulthood. It’s crucial to verify if the trials here specifically focus on the rare adult form, as the chart title suggests. If they encompass all forms, it’s misleading to present ADHD as solely a “rare disease.”
- Comparison Across Conditions: You can compare the number of trials for different diseases and discuss potential reasons for the variations. Are some conditions more prevalent? Do some have more established research infrastructure or advocacy?
- Relative vs. Absolute Numbers: While the chart shows absolute numbers, consider discussing the relative burden of each disease. Does the number of trials align with the prevalence or unmet need for each condition?
- Consider the “Rarity” Aspect: The chart focuses on the “most trials,” but remember that all these diseases are categorized as “rare.” It’s important to keep this in perspective. Even the “most studied” rare diseases may still be relatively under-researched compared to more common conditions.
- Limitations: The chart only shows the top 15. It doesn’t provide a complete picture of rare disease research. Also, the criteria for “clinical trials” and “rare diseases” used in the data collection are not defined in the chart, so it’s important to understand the source data.
Questions for Further Exploration:
- What is the distribution of trials across all rare diseases, not just the top 15?
- How has the number of trials for these conditions changed over time?
- What types of trials are being conducted (e.g., treatment, diagnosis, prevention)?
- What is the funding landscape for research on these conditions?
Network Graph of Rare Disease Co-Occurrences (Top 20)
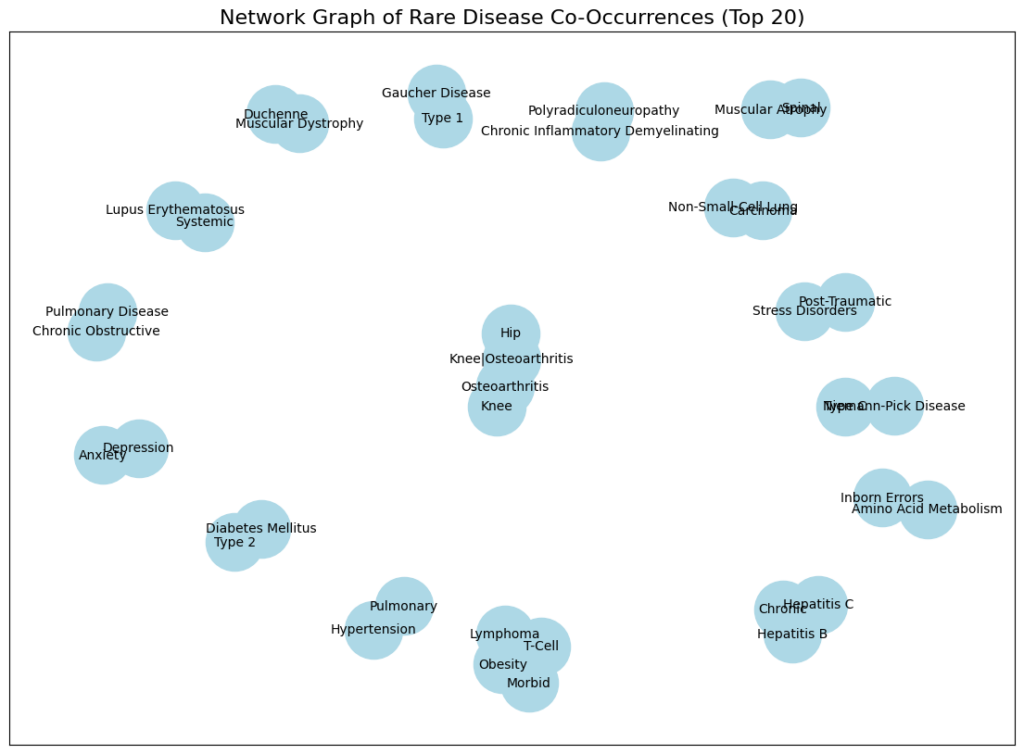
- Nodes Represent Diseases: Each node (circle) in the graph represents a specific disease or condition.
- Node Size Suggests Frequency: The size of each node likely corresponds to the frequency or prevalence of that disease within the dataset. Larger nodes indicate more frequent occurrences.
- Edges Represent Co-occurrence: The lines (edges) connecting the nodes indicate that these diseases co-occur within the same individuals more often than would be expected by chance.
- Clustering of Related Diseases: We can observe some clustering of related diseases. For example, several types of arthritis and joint-related issues cluster together. This suggests that these conditions may share underlying risk factors or mechanisms.
- Potential for Identifying Disease Subtypes: The co-occurrence patterns may help identify potential subtypes or subgroups of patients with specific combinations of diseases. This could have implications for personalized treatment approaches.
- Possible Connections Between Seemingly Unrelated Diseases: The graph reveals connections between diseases that might not be immediately obvious. For example, connections between mental health conditions (Anxiety, Depression, Post-Traumatic Stress Disorder) and physical ailments may highlight the complex interplay between mental and physical health.
Insights for Your Analysis or Report:
- Focus on the Most Frequent Co-occurrences: Discuss the strongest connections (thickest lines) and the most prominent clusters. What are the clinical implications of these frequent co-occurrences?
- Explore Connections Between Unrelated Diseases: Highlight connections between diseases that are not traditionally considered related. This could lead to new research avenues and a better understanding of shared risk factors or underlying mechanisms.
- Consider the Limitations of Co-occurrence Data: Co-occurrence does not necessarily imply causality. Just because two diseases occur together frequently doesn’t mean that one causes the other. There could be other confounding factors at play.
- Discuss the Implications for Diagnosis and Treatment: How can the information about disease co-occurrences be used to improve diagnosis and treatment strategies? Could screening for one disease prompt screening for others that are frequently co-occurring?
- Limitations of the Data: The graph only shows the top 20 co-occurrences. It doesn’t provide a complete picture of all disease co-occurrences. Also, the criteria for “co-occurrence” and the specific dataset used are not defined in the chart, so it’s important to understand the source data.
- Further Research: This graph can be a starting point for more in-depth research. Researchers could investigate the underlying reasons for the observed co-occurrences and explore potential shared risk factors, genetic links, or environmental influences.
Specific Disease Observations (with caveats, as context is limited):
- Muscular Dystrophy and Related Conditions: The clustering of muscular dystrophies suggests that individuals with one type may be at risk for others or related complications.
- Mental Health Connections: The connections between Anxiety, Depression, and PTSD highlight the importance of considering mental health in individuals with other medical conditions.
- Osteoarthritis Cluster: The grouping of different forms of osteoarthritis is expected, as they share similar underlying mechanisms.
- Potential Metabolic Connections: The presence of Type 2 Diabetes Mellitus alongside obesity and other conditions suggests potential metabolic links that warrant further exploration.
Flow of Rare Disease Trials Across Phases & Outcomes

- Phases on the Left: The left side of the diagram lists the various trial phases, from Early Phase 1 to Phase 4, including combined phases.
- Outcomes on the Right: The right side shows the different trial outcomes, such as Completed, Recruiting, Terminated, etc.
- Flow Represents Trial Progression: The ribbons connecting the phases to the outcomes represent the movement of trials from one phase to a particular outcome. The wider the ribbon, the more trials are associated with that flow.
Specific Insights:
- Phase 2 Trials Predominate: The largest flow originates from Phase 2, indicating that a substantial proportion of rare disease trials are conducted at this stage.
- Completed and Recruiting are Major Outcomes: The two most significant outcomes are “Completed” and “Recruiting,” suggesting that a large number of trials either reach completion or are still in the process of recruiting participants.
- Significant Attrition: A considerable number of trials are “Terminated,” “Suspended,” or “Withdrawn,” highlighting the challenges and attrition inherent in clinical research. This demonstrates that many trials do not progress to completion for various reasons (e.g., lack of efficacy, safety concerns, funding issues, etc.).
- Relatively Few Trials in Early Phases: The flows from Early Phase 1 and Phase 1 are comparatively smaller, suggesting that fewer trials initiate at these early stages. This could be due to various factors, such as difficulties in developing suitable early-phase trial designs for rare diseases or challenges in recruiting enough participants.
- Phase 2 to Recruiting Flow: A significant flow goes from Phase 2 to “Recruiting.” This might seem counterintuitive as “Recruiting” usually implies trials that are actively seeking participants, typically in earlier phases. However, in this context, it could indicate:
- Trials transitioning to a different phase but still recruiting: Some trials might progress to a later phase (e.g., Phase 3) but still be actively recruiting participants.
- Trials with long recruitment periods: Rare disease trials often face challenges in recruiting enough participants due to the limited patient pool. Therefore, trials might remain in a “Recruiting” status for an extended period, even if they have technically moved to a later phase.
- Limited Movement to “Approved for Marketing”: Only a small fraction of trials ultimately leads to the “Approved for Marketing” outcome. This underscores the challenges and low success rate in developing new treatments for rare diseases.
Number of rare disease trials over time

- Dramatic Increase in Recent Years: The most prominent feature is the steep, almost vertical, rise in the number of trials starting around 2000, continuing through 2022. This indicates a significant surge in research activity focused on rare diseases in the 21st century.
- Relatively Low Activity Before 2000: Prior to 2000, the number of rare disease trials was consistently low, with only a slight increase observed from the 1980s onwards.
- Plateau or Slight Decline at the End: While still high, there appears to be a plateau or possibly a slight decline in the number of trials in the last couple of years (2020-2022). This could be due to various factors, such as the COVID-19 pandemic’s impact on research, funding changes, or data collection lags.
Specific Insights and Possible Explanations:
- Increased Awareness and Funding: The dramatic increase in trials after 2000 likely reflects growing awareness of rare diseases, increased funding for research in this area (including orphan drug acts and similar legislation), and advancements in diagnostic technologies.
- Technological Advancements: Advances in genetics, molecular biology, and data science have likely played a crucial role in accelerating rare disease research and facilitating the development of new therapies.
- Changes in Regulatory Landscape: Regulatory changes, such as the Orphan Drug Act in the US and similar legislation in other countries, have incentivized pharmaceutical companies to invest in rare disease drug development.
- Patient Advocacy Groups: The rise of patient advocacy groups has contributed significantly to raising awareness, mobilizing funding, and driving research efforts for specific rare diseases.
- Impact of COVID-19: The slight plateau or decline in the number of trials towards the end of the timeline might reflect the impact of the COVID-19 pandemic, which disrupted many research activities and healthcare systems. However, it could also be a data lag or a temporary fluctuation.
Word Cloud of Rare Diseases in Clinical Trials
This word cloud visualization offers a snapshot of the prominent terms associated with rare diseases in clinical trials. Here’s a breakdown of the insights:
General Observations:
- Frequency = Size: The size of each word reflects its frequency or prevalence within the dataset of rare disease clinical trials. Larger words indicate more frequent occurrences.
- Focus on Disease Types and Characteristics: The words predominantly relate to specific diseases (e.g., “Muscular Dystrophy,” “Parkinson Disease,” “Alzheimer Disease,” “Fabry Disease”), disease categories (e.g., “Cancer,” “Lymphoma”), or disease characteristics (e.g., “Hereditary,” “Idiopathic,” “Congenital”).
- Clinical Trial Aspects: Terms like “Stage,” “Recurrent,” “Metastatic,” “Refractory,” and “Complication” suggest a focus on the progression and characteristics of diseases within the context of clinical trials.
- Demographics and General Health: Terms like “Children,” “Healthy,” “Obesity,” “Diabetes Mellitus,” and “Hypertension” suggest a consideration of patient demographics and general health conditions that might be relevant to rare diseases or clinical trial participation.
Specific Insights:
- “Disorder” and “Disease” as Central Themes: The large size of “Disorder” and “Disease” emphasizes that the data focuses on diseases and disorders rather than other aspects like treatments or research methodologies.
- Emphasis on Cancer: “Cancer,” “Carcinoma,” “Lymphoma,” “Lung Cancer,” “Breast Cancer,” “Colorectal Cancer,” and “Prostate Cancer” are all prominent, indicating a significant representation of cancer-related rare diseases in the clinical trials.
- Neurological Conditions: “Muscular Dystrophy,” “Parkinson Disease,” “Alzheimer Disease,” “Spinal Muscular Atrophy,” and “Ataxia” highlight a focus on neurological rare diseases.
- Genetic and Developmental Aspects: Terms like “Hereditary,” “Idiopathic,” “Congenital,” “Mutation,” and “Inborn Errors” emphasize the role of genetic factors and developmental origins in many rare diseases.
- Comorbidities and Risk Factors: The presence of terms like “Obesity,” “Diabetes Mellitus,” and “Hypertension” suggests that these common health issues might be relevant as comorbidities or risk factors in some rare diseases.